
The Standalone Information Product Canvas App
A standalone app to create, manage and export your Information Product Canvases at scale

Do you prefer the feel and joy of reading a physical book?
Its a problem of Scale
For a while now, there have been a number of open source templates formats I have created and made available for the Information Product Canvas. Blank PNGs, PDFs, Google Slides, PowerPoint.
You can find them all here:
https://agiledataguides.com/project/information-product-canvas-templates/
These templates work well when you are capturing the requirements for a handful of Information Products. You run a Pattern Storming Canvas Workshop, you interactively fill in a Google Slide or sketch it on a whiteboard, you take a photo or save the file. Job done.
But what happens when you start to scale?
When an data team moves from capturing 3 or 4 Information Products to 10, 20, or 100, the current template formats starts to creak.
Managing 100’s of Google Slides is not fun. Finding the canvas you completed six months ago, the one with the Business Questions about customer churn, means scrolling through a long deck hoping you remember which slide it was on.
Comparing canvases across a multiple data domains, multiple data teams becomes a full time task in itself.
It needs to scale but not lose the core of what makes the pattern successful
The natural reaction from data teams is to move the canvas into a tool like Jira or Confluence. Structure it as a table. Add some fields. Maybe build a form so stakeholders can fill it in themselves.
I have written about why this is an anti-pattern before.

The canvas format works because it is visual, collaborative, and designed for people to have conversations and collaboration over “logging a ticket” and form filling.
Converting it into a table or a form breaks the visual flow, stifles collaboration, and encourages a tick-the-box mentality.
It was time to scratch the itch
So I have always had a task on my backlog to build a standalone app version of the Information Product Canvas. Something that keeps the visual canvas format but adds the ability to manage multiple canvases, search across them, and export them in useful formats. I just never got around to prioritising the spondoolies to pay somebody to build it.
That changed, I wanted to experiment with vibe coding, using Claude Code to build an app , to learn by doing, which is the way I learn the best.
And the Information Product Canvas was the obvious first cab off the rank.
I give you the Standalone Information Product Canvas App!
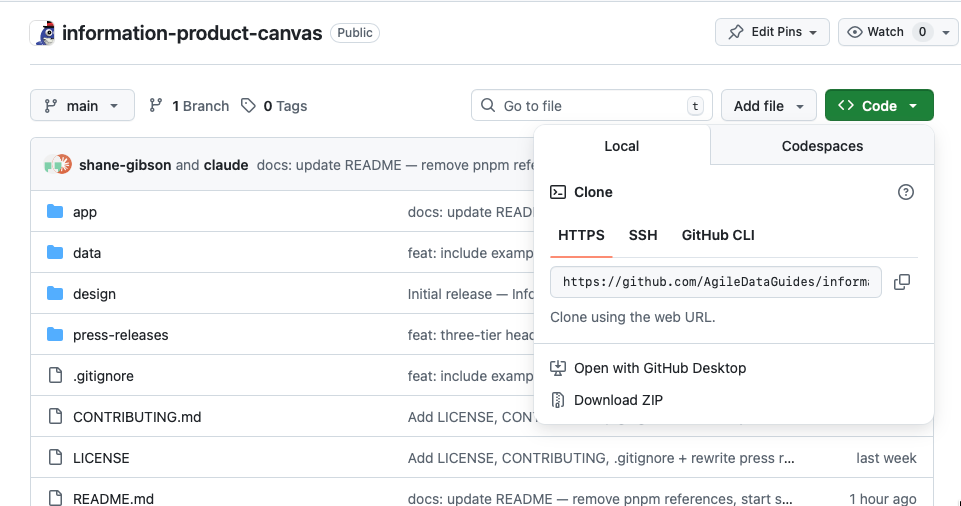
The result of my vibe coding experiment is now published as an open source app on GitHub:
https://github.com/AgileDataGuides/information-product-canvas
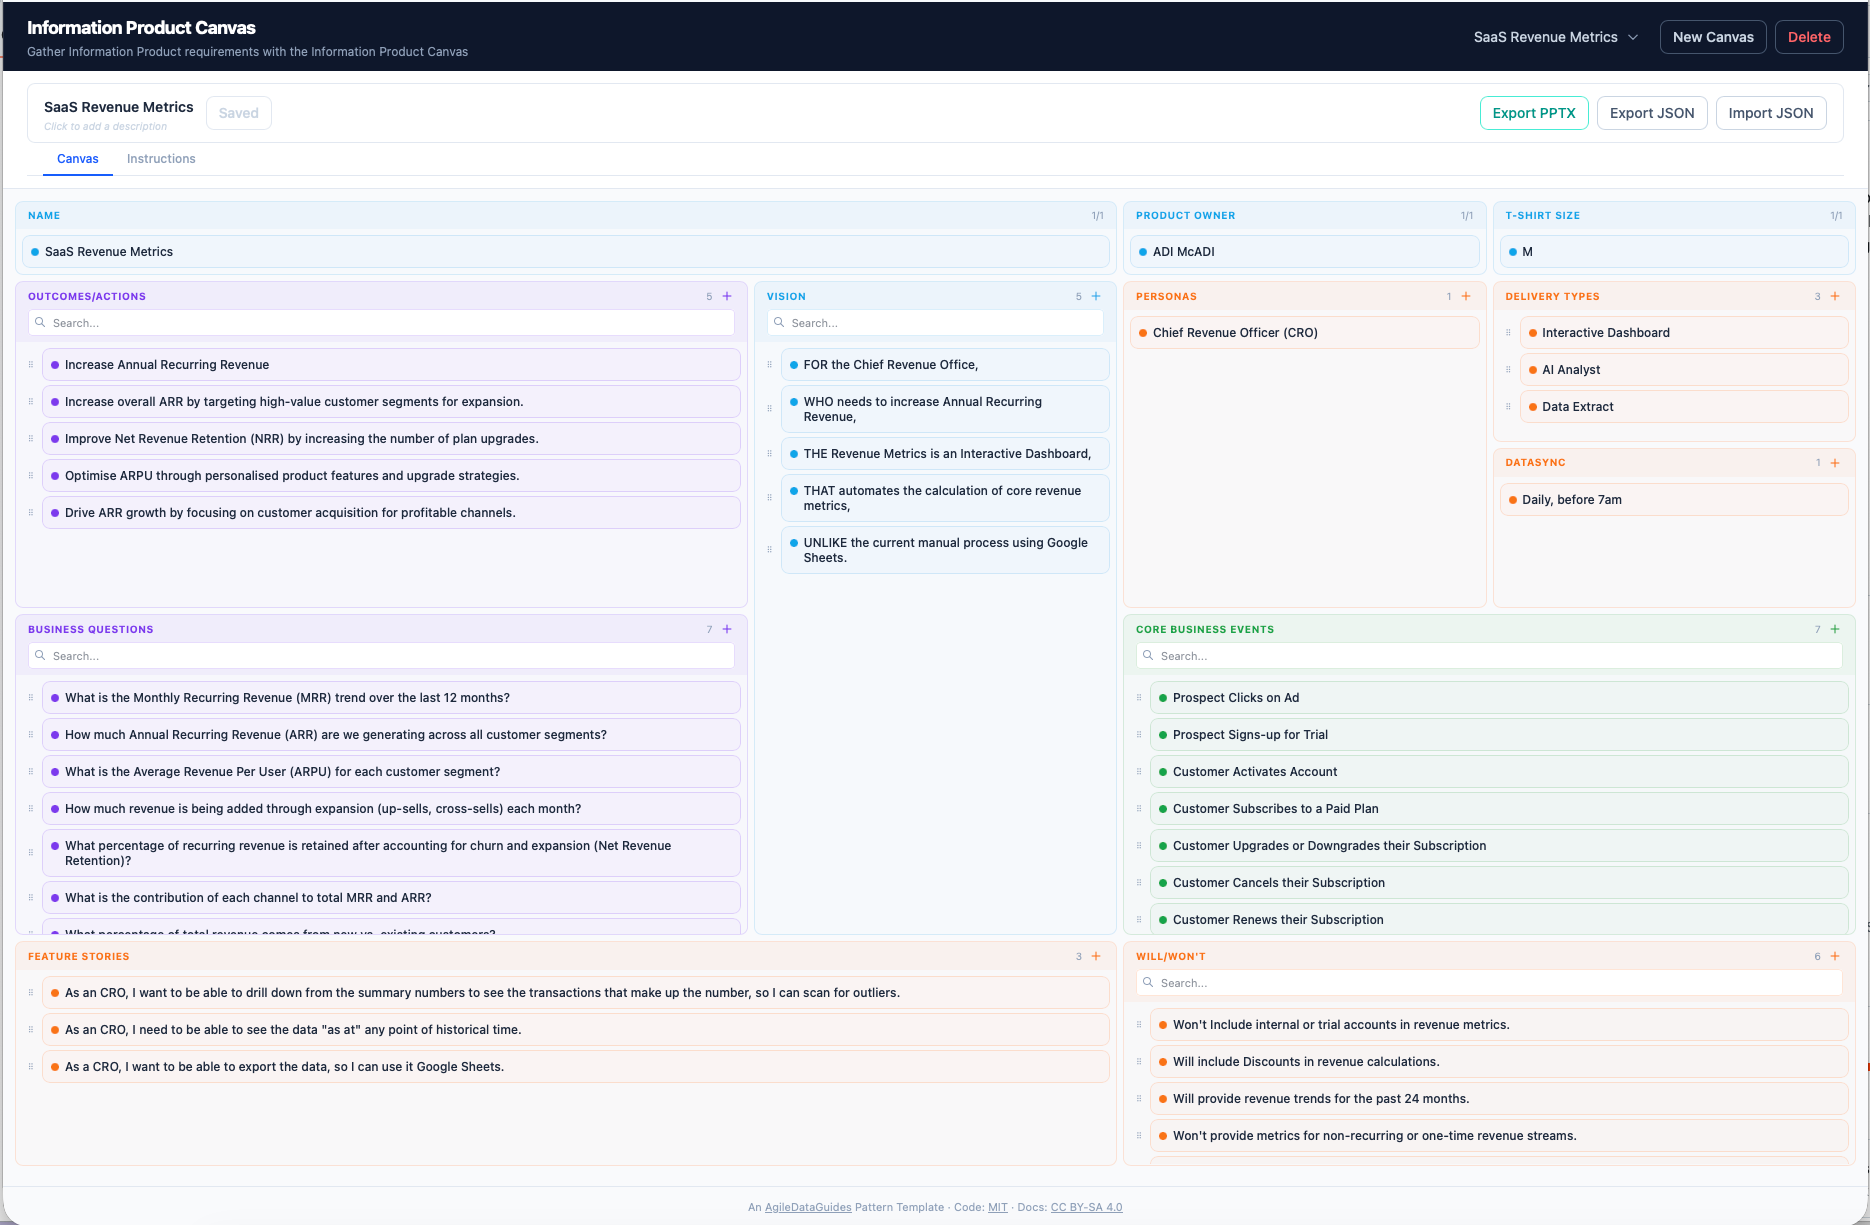
What the app does
The app gives you a standalone, local, visual canvas format to create and capture and manage your Information Product Canvases.
It runs on your machine at:
http://localhost:5115
You can create multiple canvases, switch between them, and delete the ones you no longer need.
Each canvas has all 12 areas: Business Questions, Outcomes and Actions, Personas, Vision, Delivery Types, Data Sync, Core Business Events, Feature Stories, Will/Won’t, the Information Product Name, Product Owner, and T-Shirt Size.
Editing is inline. Add a new card in any area, double-click to rename, drag and drop to reorder it, click the bin to delete it.
When you need to share or move your canvases, there are a few export options.
You can export as JSON, which is useful for backup, sharing, or feeding into other tools, such as Claude or ChatGPT.
You can import a previously exported JSON file, to bring a canvas completed by somebody else into your local version of the app.
And you can export to PowerPoint, which generates a slide per Information Product, handy for when you need to present your canvases to stakeholders who live in slide decks, or import it onto Google Slide (cause we all know Google Slides is better than Microsoft Powerpoint right!).
The export to PowerPoint is a bit buggy at the moment, if anybody can help me make it better then jump in!
Works with Claude
One of the things I am most pleased with is how well the exported JSON works with Claude. You can export your canvas, drop the JSON into Claude Chat or Claude Code, and start asking questions about your Information Product.
Things like “Do my Business Questions align with what my Personas actually need?” or “This feels too big, suggest a way to break it into smaller Information Products” or “Draft a concept model based on my canvas.”
The canvas captures the requirements. Claude helps you think about them.
How to get it running
Head off to:
Clone the repo or download the zip file and unzip it on your local device.
And then either double-click start-IPC.command on macOS or run ./start-IPC.sh from the terminal.
You will need Node.js (v18 or later) and npm installed.
The app is MIT licensed so you can use it, modify it, and share it freely.
A heads up
This is a local app, designed to run on your own machine.
DO NOT expose it to the internet or deploy it on a public server. There is no user authentication, so anyone who can reach the server can read and overwrite your data. If you need to share your work, use the export buttons and share the files manually.
What is next
I will keep iterating the app based on feedback. If you use it, find a bug, or have an idea for a feature, raise an issue on GitHub or reply to this email.
I will also be writing about the experience of vibe coding this and a couple of apother apps with Claude Code over on my Agile Data N’ Info Substack.

If you are curious about what it is like to build an app through conversation rather than writing code, that series starts there.
Do you prefer learning via virtual in-person courses?
Do you prefer the feel and joy of reading a digital book?